Solar Monitor
Comprehensive space weather monitoring — NOAA SWPC, NASA SDO, SOHO coronagraphs & real-time solar wind data
Every panel is observed measurement or published model output from NOAA SWPC, NASA SDO and SOHO. Nothing here computes or implies any correlation, and nothing predicts.
Kp Index
—
Geomagnetic
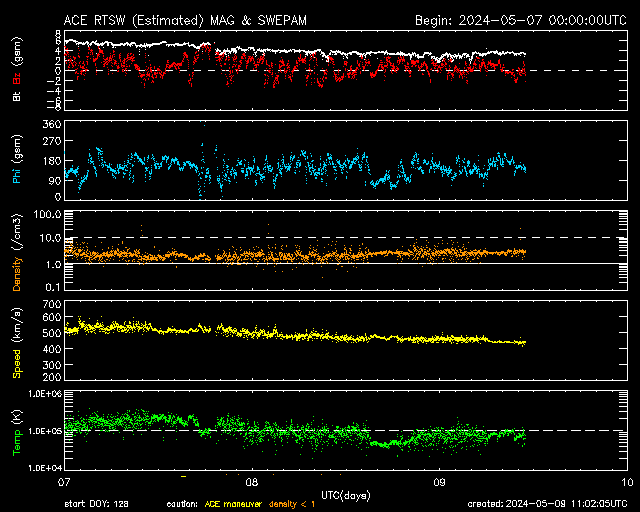
Solar Wind
—
km/s
X-Ray Flux
—
GOES Class
Proton Flux
—
pfu (>10 MeV)
SOLAR ACTIVITY MONITORING
Real-time flare detection & energy flux📈 X-Ray Flux (Solar Flares)
GOES · SWPC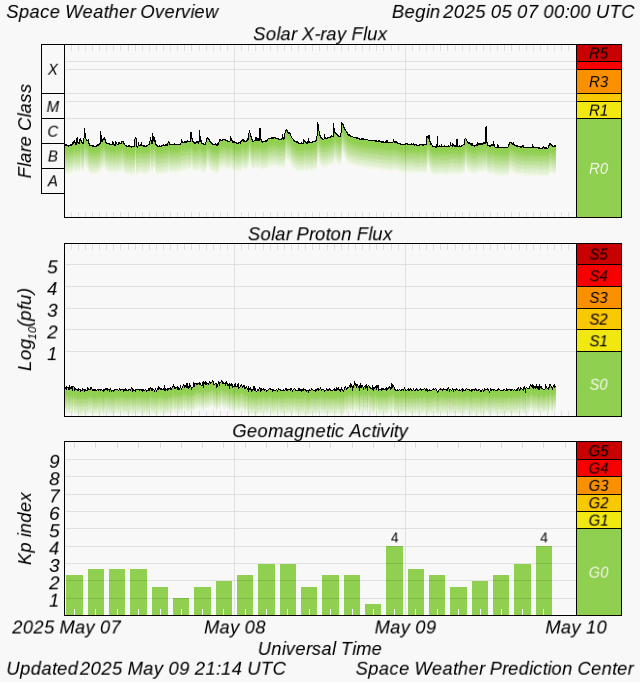
⚡ Proton Flux
ACE SIS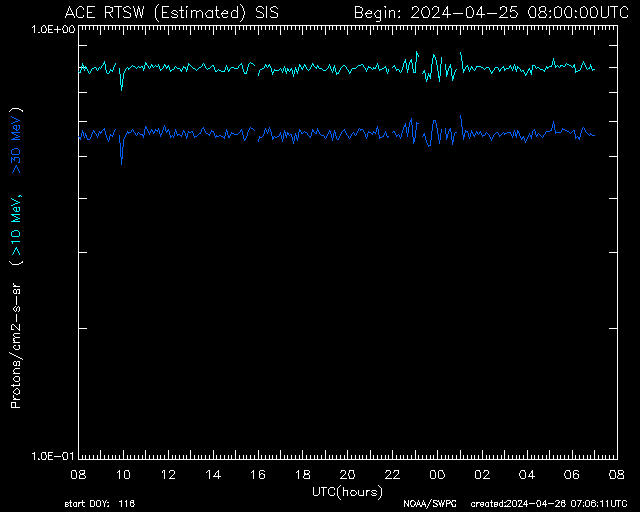
⚡ Electron Flux
ACE EPAM
🔆 Solar Cycle Progression
SILSO · ROB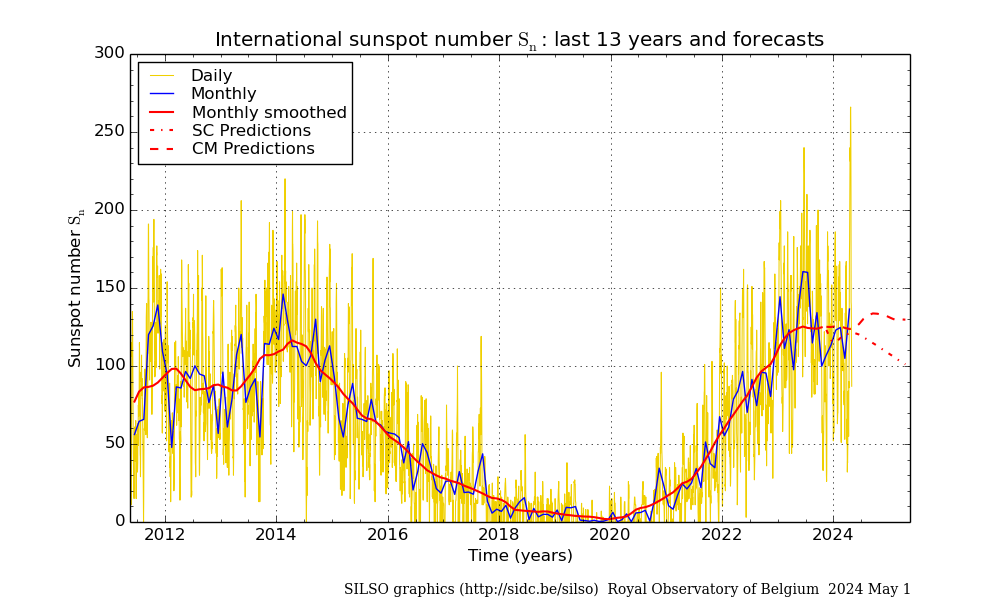
SUVI SOLAR IMAGERY — 6 WAVELENGTHS
GOES-19 Solar Ultraviolet Imager094Å
Flares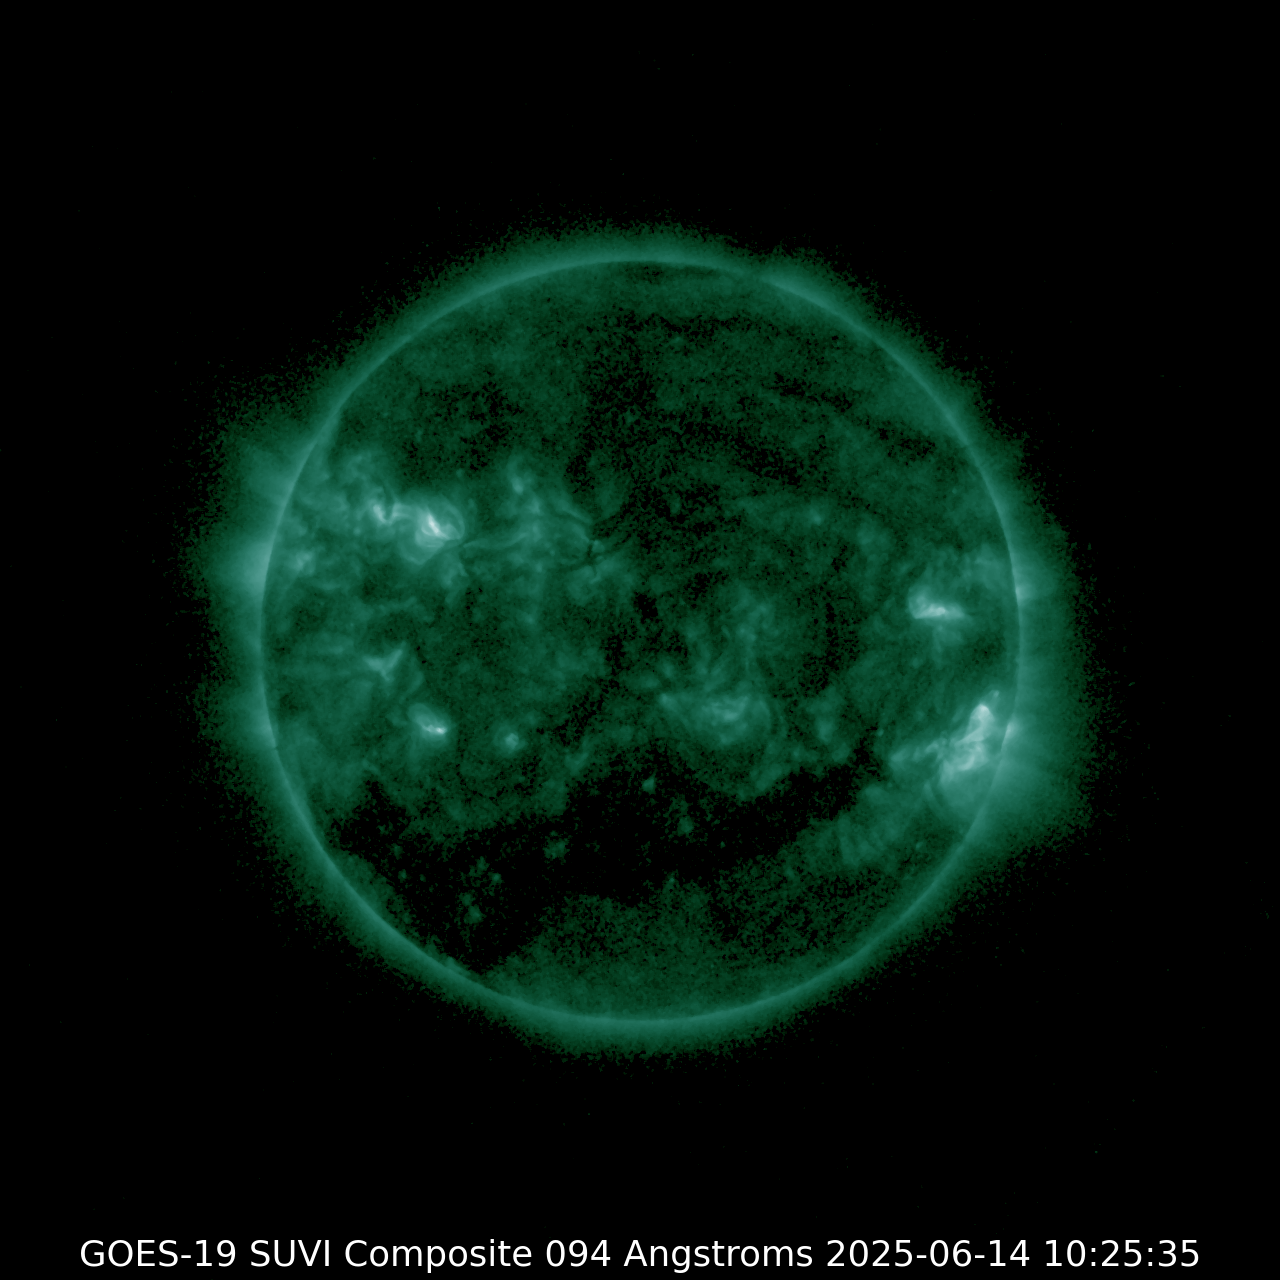
131Å
Active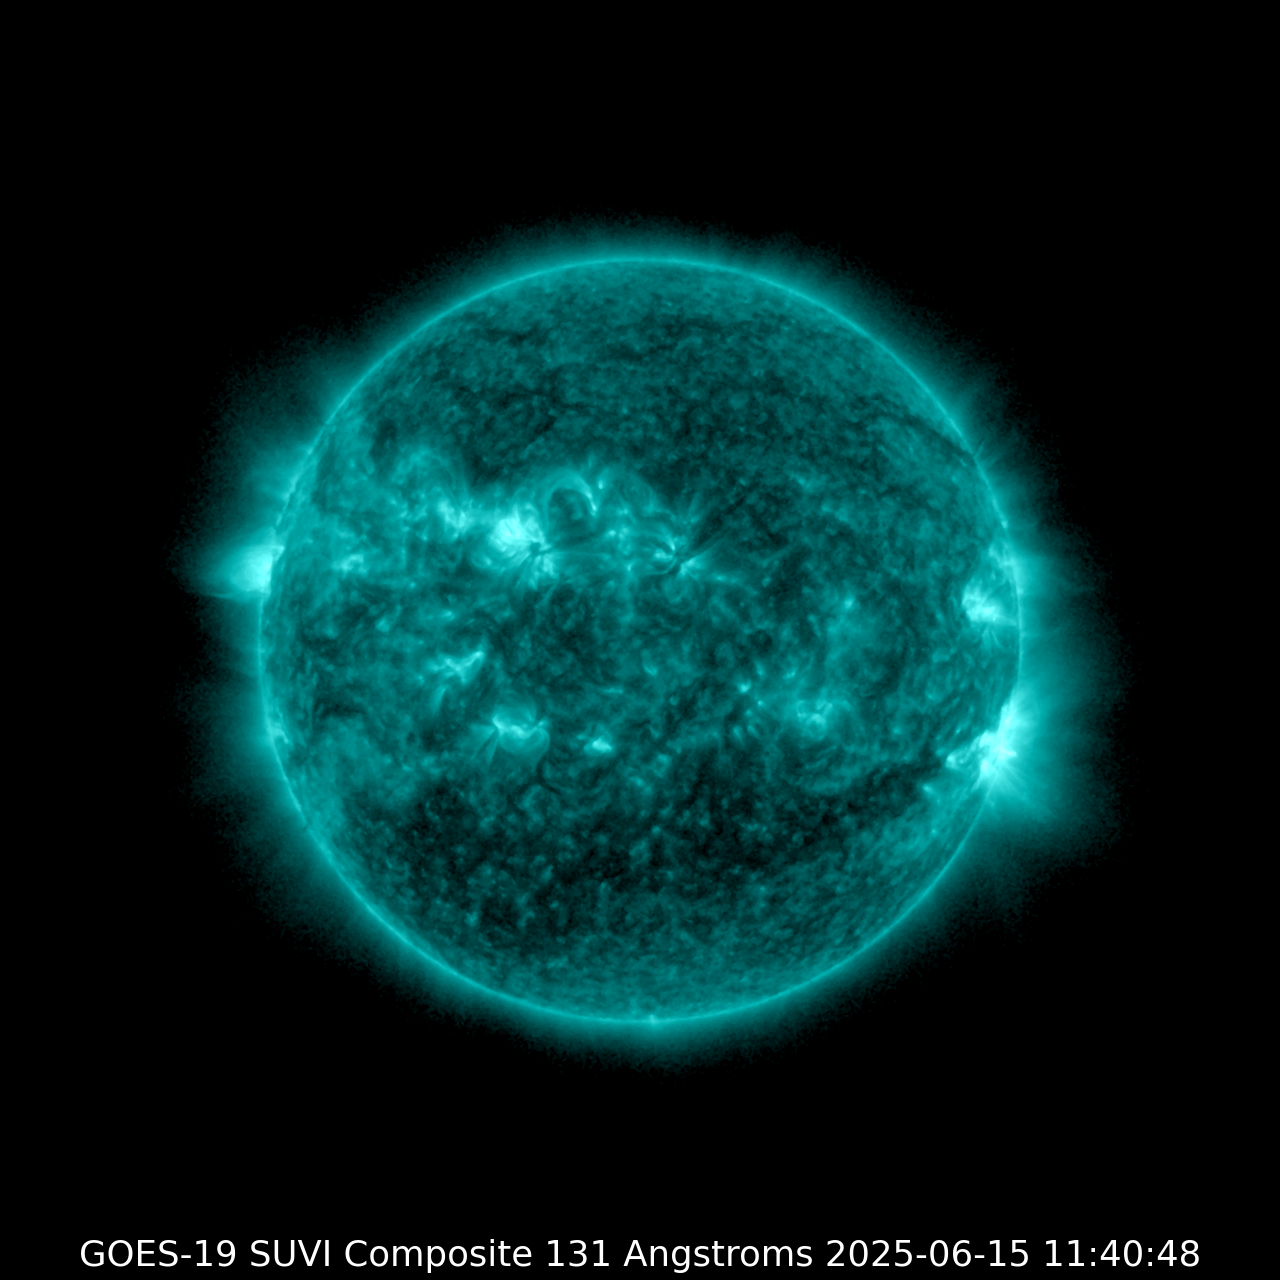
171Å
Corona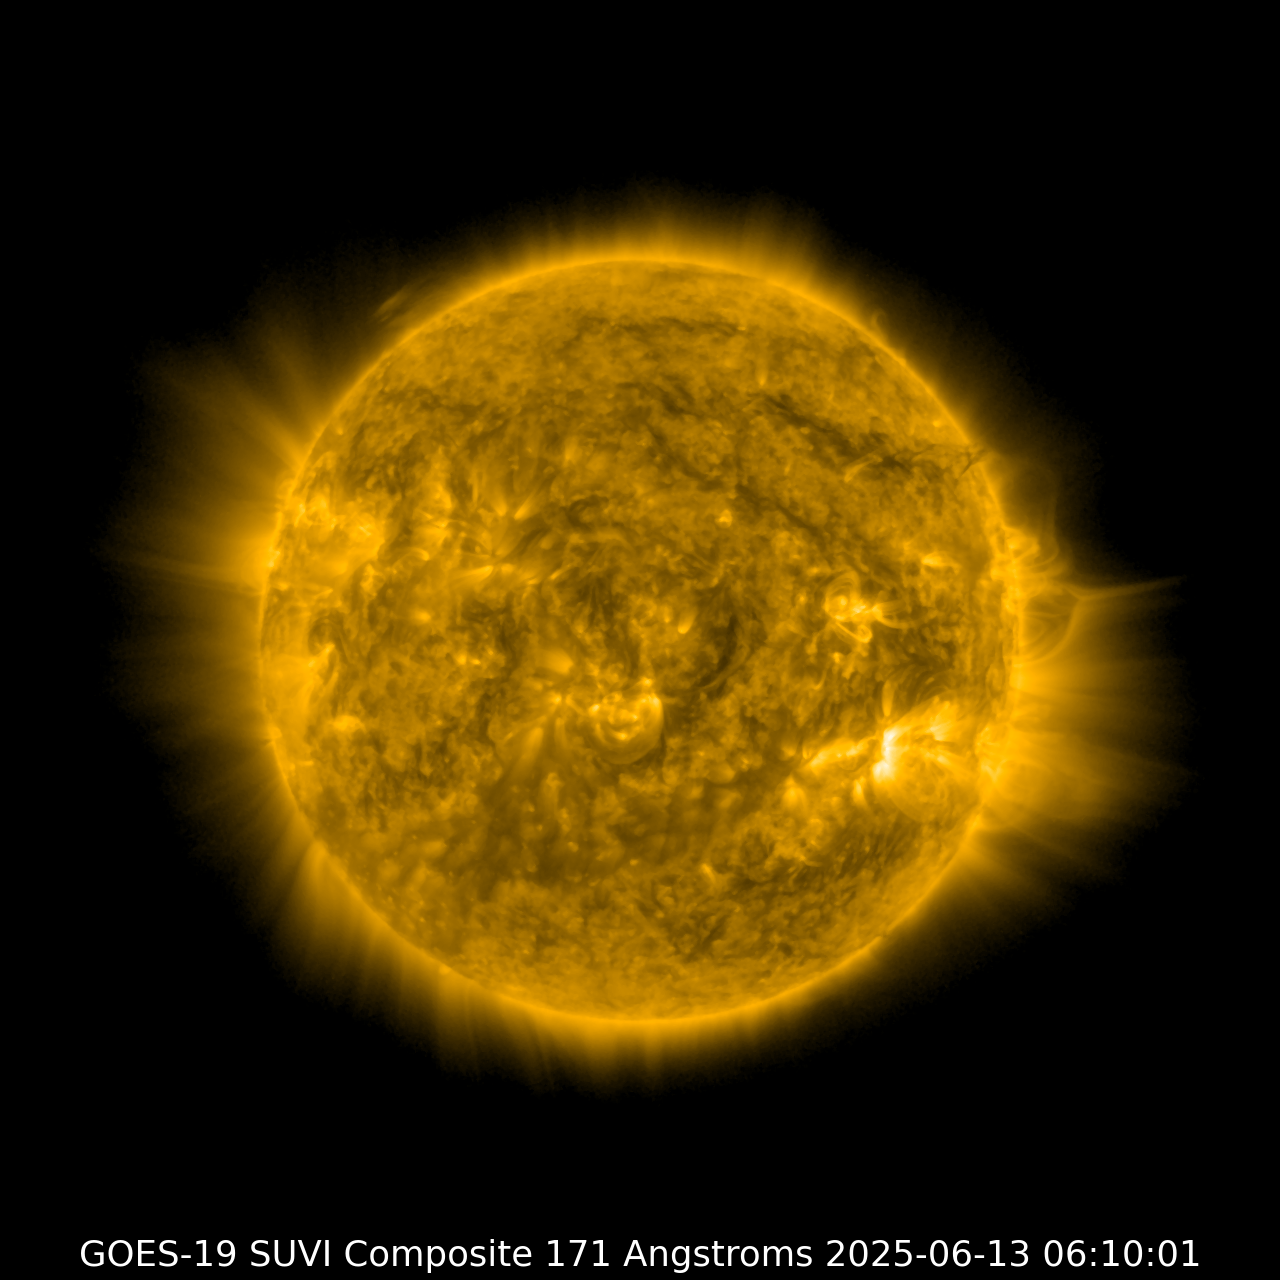
195Å
Loops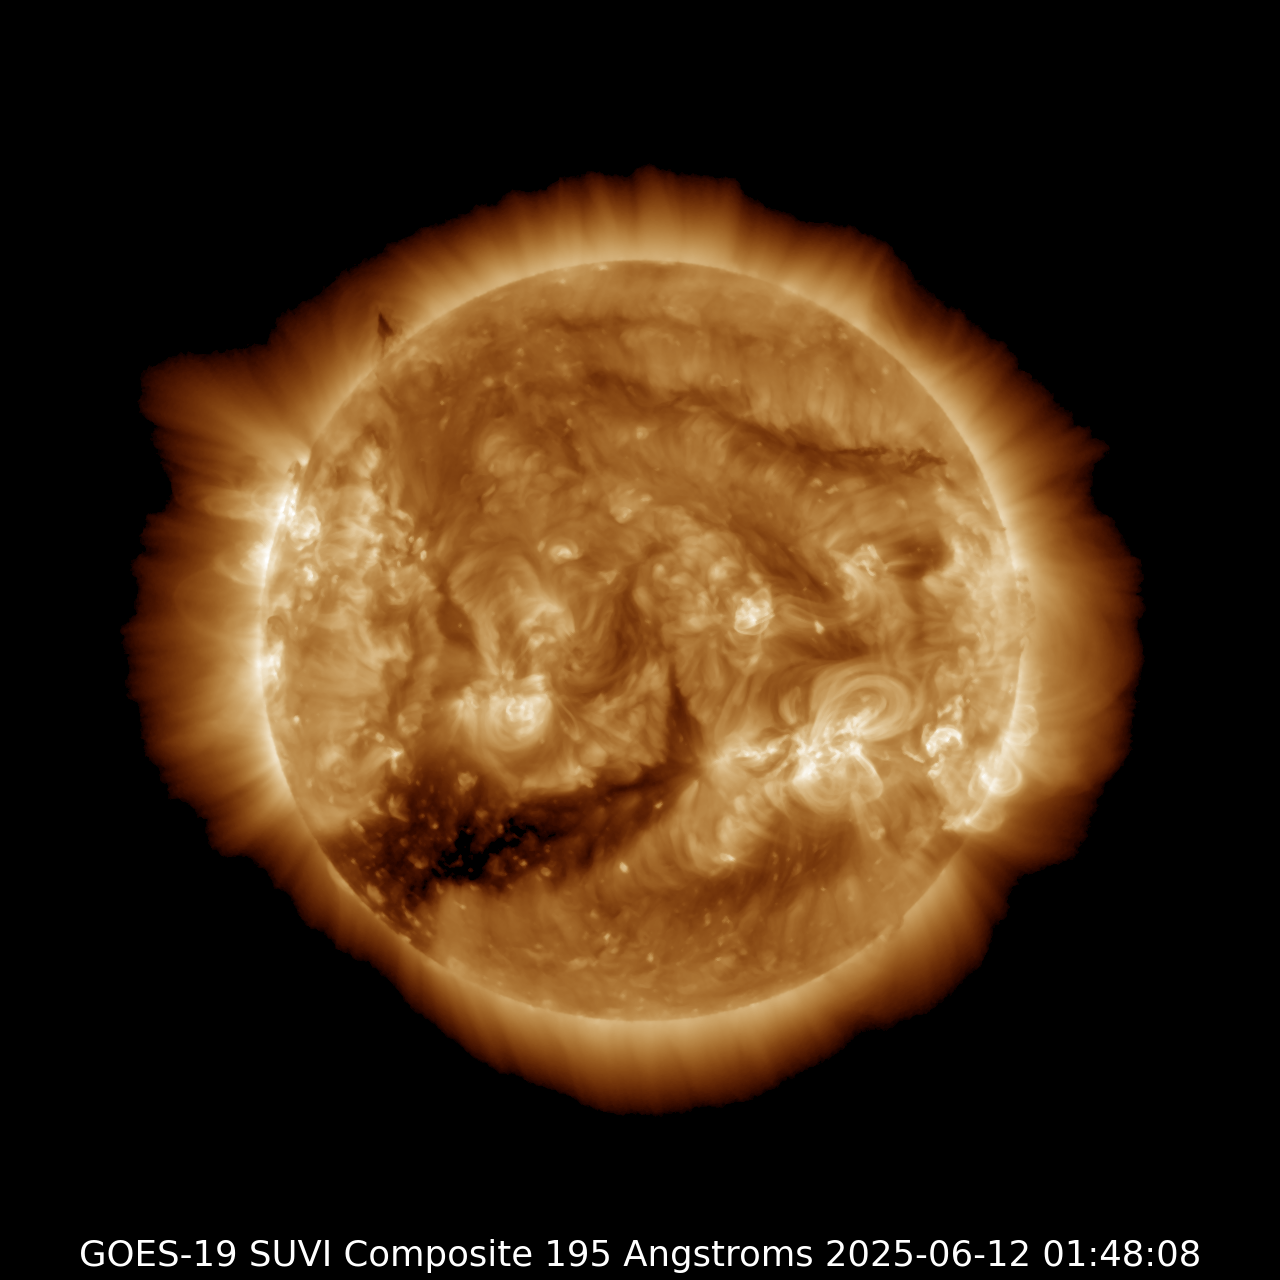
284Å
Regions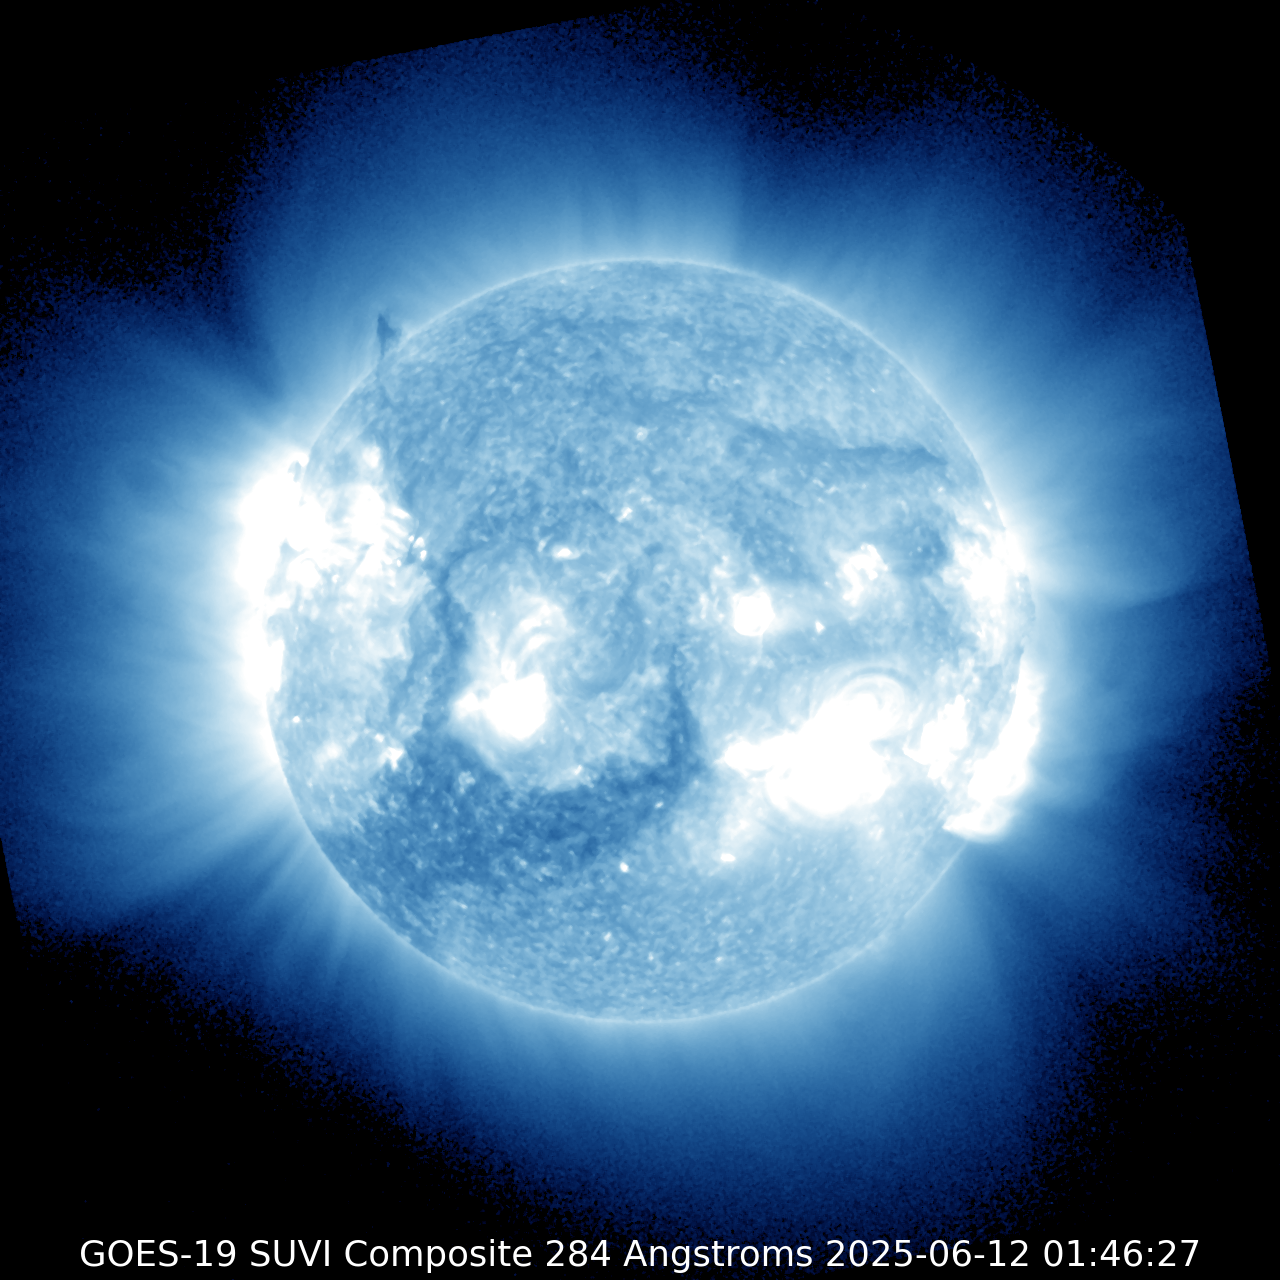
304Å
Chromo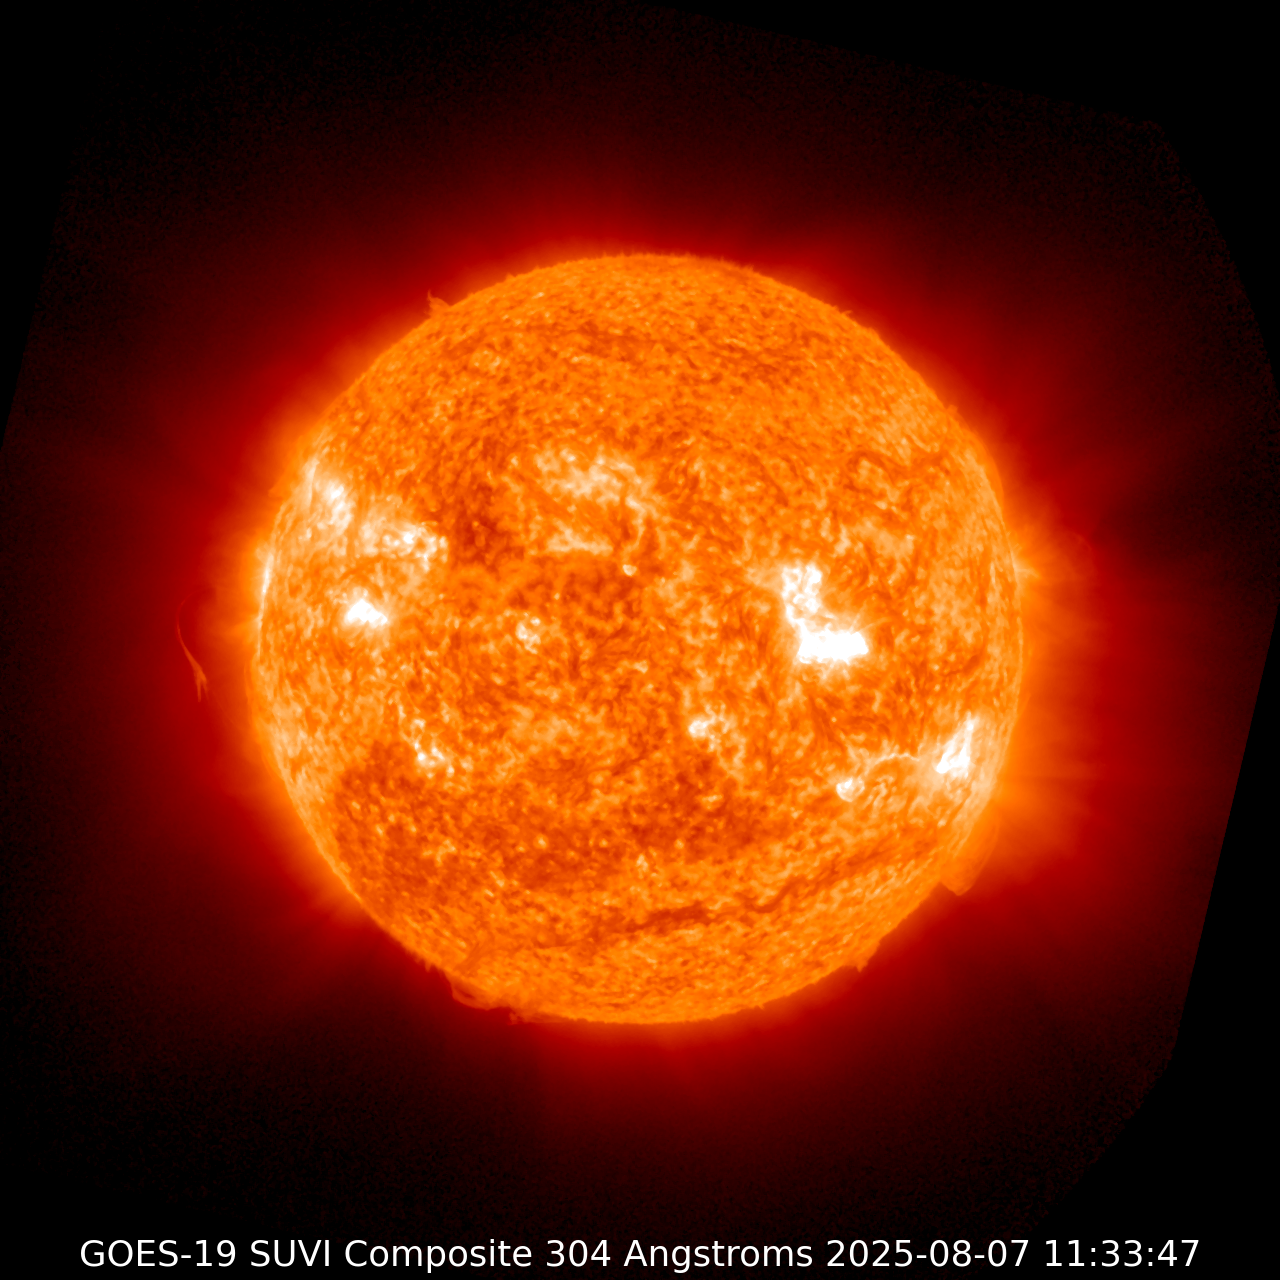
CME DETECTION — CORONAGRAPHS
Coronal Mass Ejection monitoring🔭 LASCO C2 Coronagraph
SOHO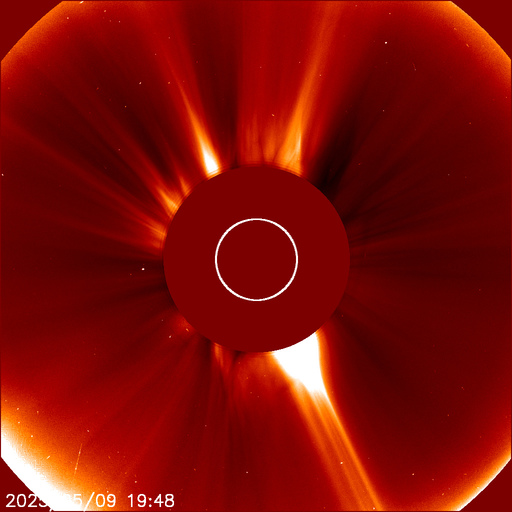
🔭 LASCO C3 Coronagraph
SOHO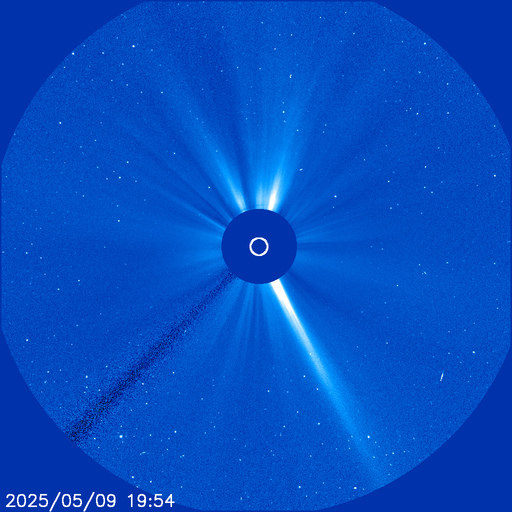
SOLAR WIND & MAGNETOSPHERE
DSCOVR L1 position & geomagnetic response — aurora now on the Sky monitor💨 Solar Wind (24hr)
DSCOVR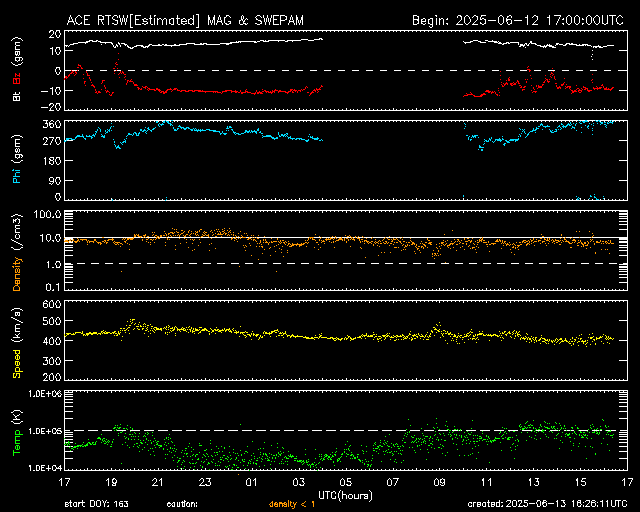
🧲 Kp Index
NOAA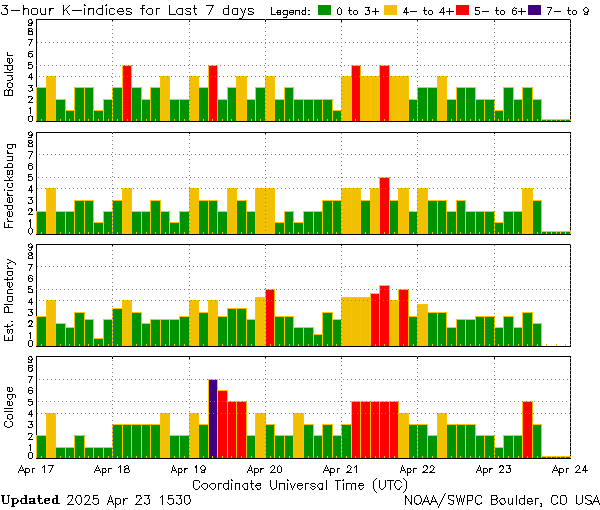
🧲 Dst Index
Kyoto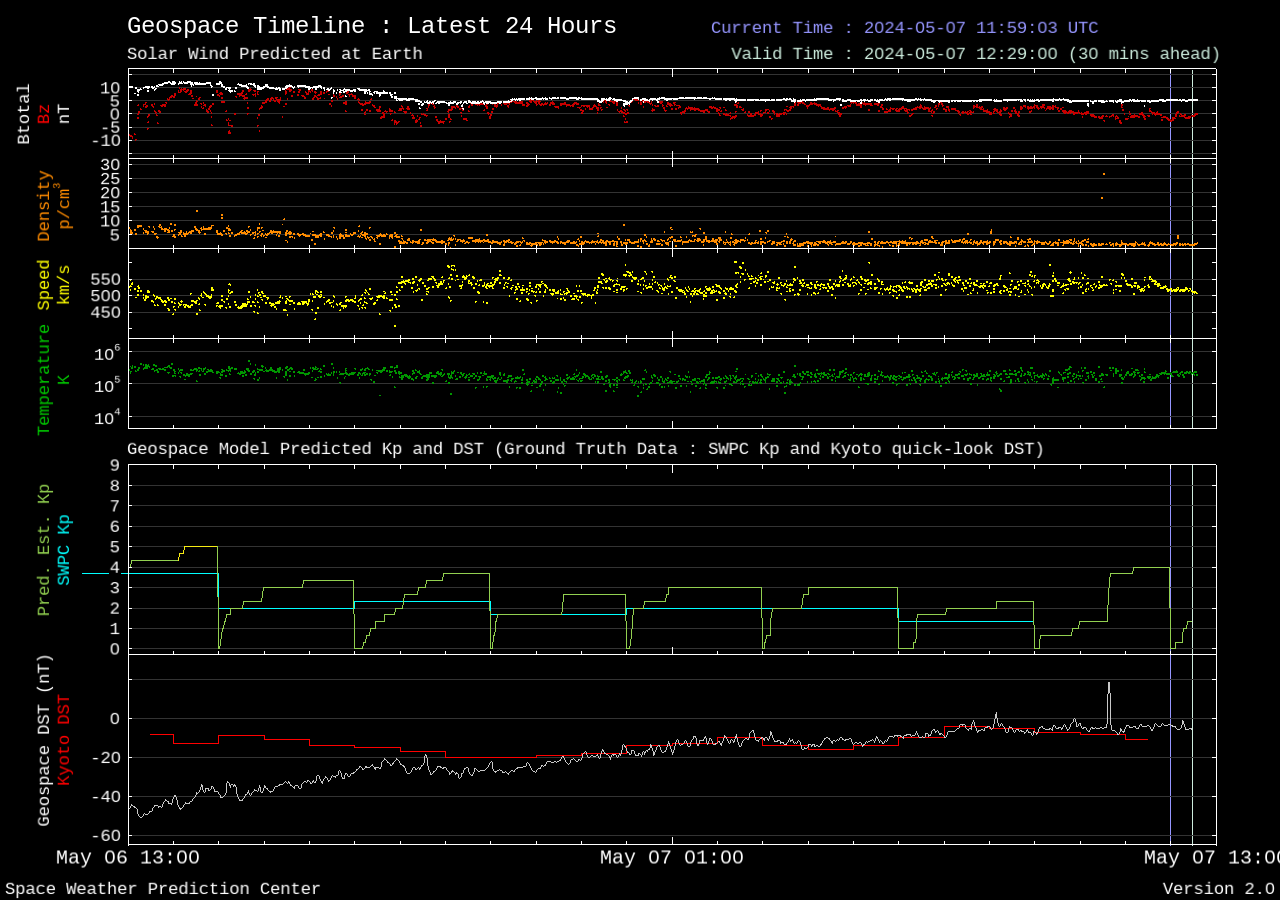
IONOSPHERE & RADIO PROPAGATION
HF absorption & Total Electron Content📡 D-RAP (HF Absorption)
NOAA
WSA-ENLIL CME PROPAGATION MODEL
Solar Wind Activity🌀 Enlil Solar Wind Density
NASA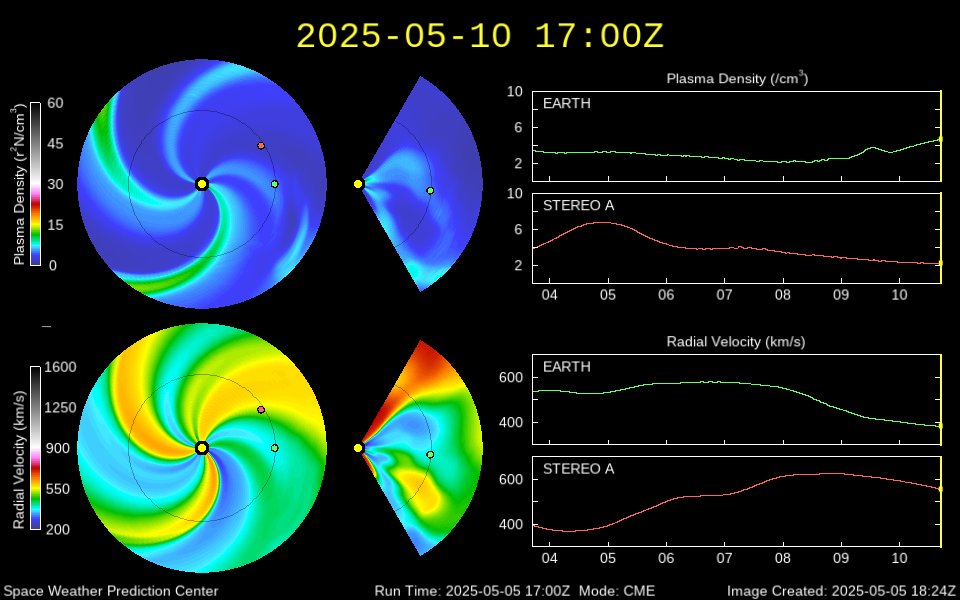
📊 3-Day Solar Wind
DSCOVR