
GEOMAGNETIC STORMS VS GLOBAL EARTHQUAKE RATE
Do geomagnetic storms (Kp ≥ 7-/8-/9-) show any measurable effect on the number of declustered earthquakes in the following 14 days?
- NULL
- Result
- 295
- n (headline cell)
- 1.015
- Rate ratio
- 0.454
- two-sided p
- 0.977–1.052
- 95 % range (ratio)
- 6
- Cells tested
- 3
- Files fingerprinted
What was compared
Both series come straight from the agency that publishes them. Nothing is pre-filtered, nothing is hand-picked; the download is cached and fingerprinted (see 05).
| Role | Series | Primary source | Range · catalogs |
|---|---|---|---|
| Factor | GFZ Kp index (definitive) | https://kp.gfz.de | 1932 → 2026-07-24 |
| Target | USGS ComCat | https://earthquake.usgs.gov/fdsnws/event/1/ | A: M5.5+ 1973→ · B: M7.0+ 1932→ |
How the test was run
Storm onset after ≥7 quiet days (no day at or above the same Kp threshold in the previous 7); declustered (Gardner–Knopoff 1974) counts on days +1…+14 after onset vs. the expected rate (the mean of the shuffled null), vs. the 14 d before, and a 2000-draw shuffled-onset null (dates shuffled within the same calendar year); two-sided p. NULL is declared only where a ±15 % change would have been detectable.
Every cell, nothing left out
Ratio 1.0 means the window after the factor held exactly as many events as any random window. A p above 0.05 means the random draws produced the observed count routinely. The 95 % range says how big a change the cell could have seen: NULL is only declared where a ±15 % change was detectable; a cell that shows no effect but could not have seen one that small is marked INCONCLUSIVE, not NULL.
| catalog | storm class | n | Observed / window | Expected / window | Ratio | 95 % range | two-sided p | Result |
|---|---|---|---|---|---|---|---|---|
| A · M5.5+ · 1973→ | Kp ≥ 7- (G3 and up) | 295 | 9.475 | 9.337 | 1.015 | 0.977–1.052 | 0.454 | NULL |
| A · M5.5+ · 1973→ | Kp ≥ 8- (G4 and up) | 113 | 9.584 | 9.407 | 1.019 | 0.957–1.08 | 0.549 | NULL |
| A · M5.5+ · 1973→ | Kp ≥ 9- (top G4 + G5) | 25 | 9.2 | 9.373 | 0.982 | 0.842–1.121 | 0.855 | NULL |
| B · M7.0+ · 1932→ | Kp ≥ 7- (G3 and up) | 575 | 0.443 | 0.411 | 1.08 | 0.952–1.208 | 0.235 | NULL |
| B · M7.0+ · 1932→ | Kp ≥ 8- (G4 and up) | 250 | 0.436 | 0.408 | 1.07 | 0.872–1.268 | 0.514 | INCONCLUSIVE underpowered · could only see a change of ±20 % or more |
| B · M7.0+ · 1932→ | Kp ≥ 9- (top G4 + G5) | 65 | 0.492 | 0.417 | 1.181 | 0.807–1.554 | 0.391 | INCONCLUSIVE underpowered · could only see a change of ±37 % or more |
The headline cell, drawn
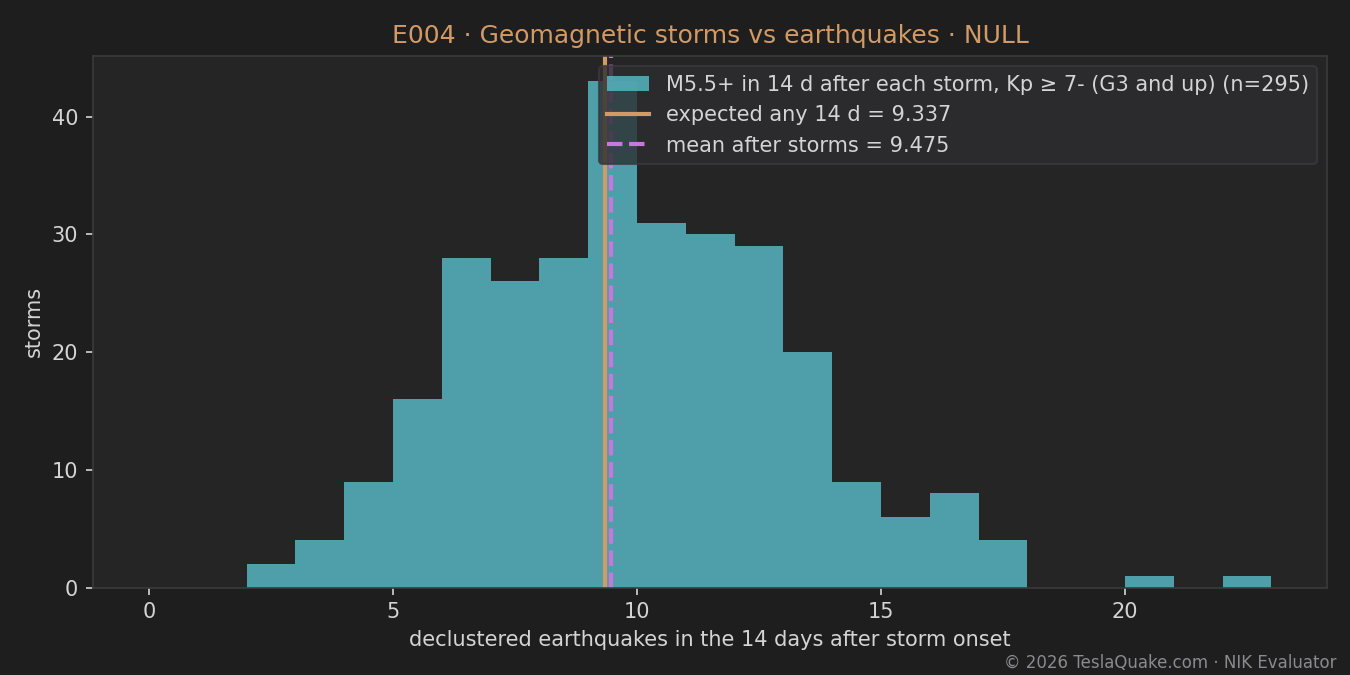
Kp begins 1932. The Carrington storm of 1859 is outside instrumental coverage and is reported separately from historical records only.
Who asked this before us
An evaluation is not a discovery. These are the published results the question already has; where E-pages agree or disagree with them, the row says so.
- Love, J. J. & Thomas, J. N. (2013). Insignificant solar-terrestrial triggering of earthquakes. Geophysical Research Letters 40, 1165–1170. doi:10.1002/grl.50211 — Same question, independent method (sunspots, solar wind, geomagnetic indices vs global earthquake occurrence): no measurable effect. E004 agrees.
- Gardner, J. K. & Knopoff, L. (1974). Is the sequence of earthquakes in Southern California, with aftershocks removed, Poissonian? Bull. Seismol. Soc. Am. 64, 1363–1367. — Declustering windows used here.
Reproduce every number above
The script downloads both series from the agencies, declusters, draws the null and writes E004_result.json. Change --window, --draws or --seed and see whether anything moves.
python3 tq_eval_004_storms.py --seed 369 --draws 2000 --window 14 --out . --analysis-end 2026-07-24
| Item | Value |
|---|---|
| Script | tq_eval_004_storms.py v1.3.1 |
| Script SHA-256 | 2ca595f36ff8e2e774f2b286c415bc94fb3682f9dd2b2145ee777f1ed3ffe718 |
| Run on | NIK · 2026-09-09 · seed 369 |
| Source copy | E004_reproduce.zip — the script, the three data files it used and its result.json, in one download. |
SHA-256 of every cached download
SHA-256 identifies the exact files this run used — the same files shipped in E004_reproduce.zip. The analysis window is pinned to 2026-07-24, so the command in the zip's README reproduces these numbers on any date. USGS ComCat is revised continuously and definitive Kp grows monthly, so a fresh download will not match these hashes; compare against the files in the zip.
| File | SHA-256 |
|---|---|
| kp_daily_max.json | 082507cc361095eaabcb9845cca71f064252aa04ca420575304baeb958c92c69 |
| quakes_M5.5_1973.csv | 0ac6797e7e28479968a9947d7f7c0c5399fb47badd0a1edd764005ecf8efa55e |
| quakes_M7.0_1932.csv | 5706fe97a042ad08b54412d04a8fb9e307f4408b5b87f92a770e2300c2bb18c0 |